Chapter 2 Installation and Setup
If you are using R for into stats, I am going to assume you are accessing it through R Studio, which has become the de facto interface for new R users. If you aren’t using R Studio or Posit Cloud, you can probably skip this chapter. The rest of the book should still be helpful, though.
There are two ways you can prepare R and R Studio for class. Both options are free to set up and use.
The first option is to download both programs onto your personal computer. The download and installation steps are pretty straightforward (see below) but you will need a good understanding of your computer and it’s file system (the topic of Computer File Systems and Working Directories) in order to use this approach. It’s mostly recommended for students who think they might be doing more analysis beyond this one course.
The second option is to sign up for a Posit Cloud account (Posit is the parent company of R Studio). Posit Cloud is relatively new but is quite stable and has become my preferred option for students in intro stats. The primary benefit is a much simpler file system. Plus, you can upload and download files from the server pretty easily. Because you are accessing a server, you will need internet access. Posit Cloud accounts currently have a monthly time limit, but as long as you remember to close your browser tab when you are not working on your assignments, you are unlikely to come close to the time limit.
Installation Option 1: Downloading to your Personal Computer
Best for students who: (1) may need R in other courses; (2) are comfortable navigating the file and directory system on their computer.
The first thing to understand is that R and R Studio are two separate programs. R is a statistical software package maintained by the R Core Team. R Studio is an integrated development environment, or IDE, for the R ecosystem. You will use R Studio for all of your analyses, but R Studio accesses R to run the statistical computations. Strictly speaking R Studio is unnecessary, but it gives a cleaner, more user-friendly interface with some extra capabilities. It also looks similar across operating systems.
Part 1: Install R
- Go to www.r-project.org
- Select ‘CRAN’ from the menu on the left
- Select any mirror
- Select the link for your operating system
- Download the R installer
- Windows:
- Select ‘base’
- Click on ‘Download R 4.3.1 for Windows’ (or newest version)
- Mac:
- Download ‘R-4.3.1.pkg’ (or newest version)
- Windows:
- If your computer does not do so automatically, open your downloaded file and install R. Follow the default settings.
You now have a functioning version of R on your computer. If you wanted to continue without R Studio you could, but R Studio makes many processes much easier.
Part 2: Install R Studio
- Go to posit.co
- From ‘Products’, select ‘RStudio IDE’
- Scroll about half the way down the page and click on the ‘Download RStudio Desktop’ button under the Open Source Edition column
- Click ‘Download RStudio’ button.
- Click on ’Download RStudio Desktop for___’ or scroll to the ‘All Installers’ section and find the installer for your operating system/platform (stay away from Zip/tar archives - there is no help that way)
- If your computer does not do so automatically, open your downloaded file and install RStudio. Follow the default settings.
Installation Option 2: Using the Cloud
Best for students who are: (1) not likely to need R outside of this class; (2) uncomfortable navigating the file and directory system on their computer; (3) comfortable using a web-based app; (4) using a Chromebook or similar machine.
- Go to posit.co
- From ‘Products’, select ‘Posit Cloud’
- Select ‘Get started’
- Follow directions to sign up for Cloud Free
R Studio GUI
Whether you downloaded R and R Studio or set up an R Studio Cloud account, the graphical user interface, or GUI (pronounced “gooey”), looks similar. When you first open R Studio, you will see a window with three “panes” as in Figure 2.1 (In R Studio Cloud, this will all be inside your browser).
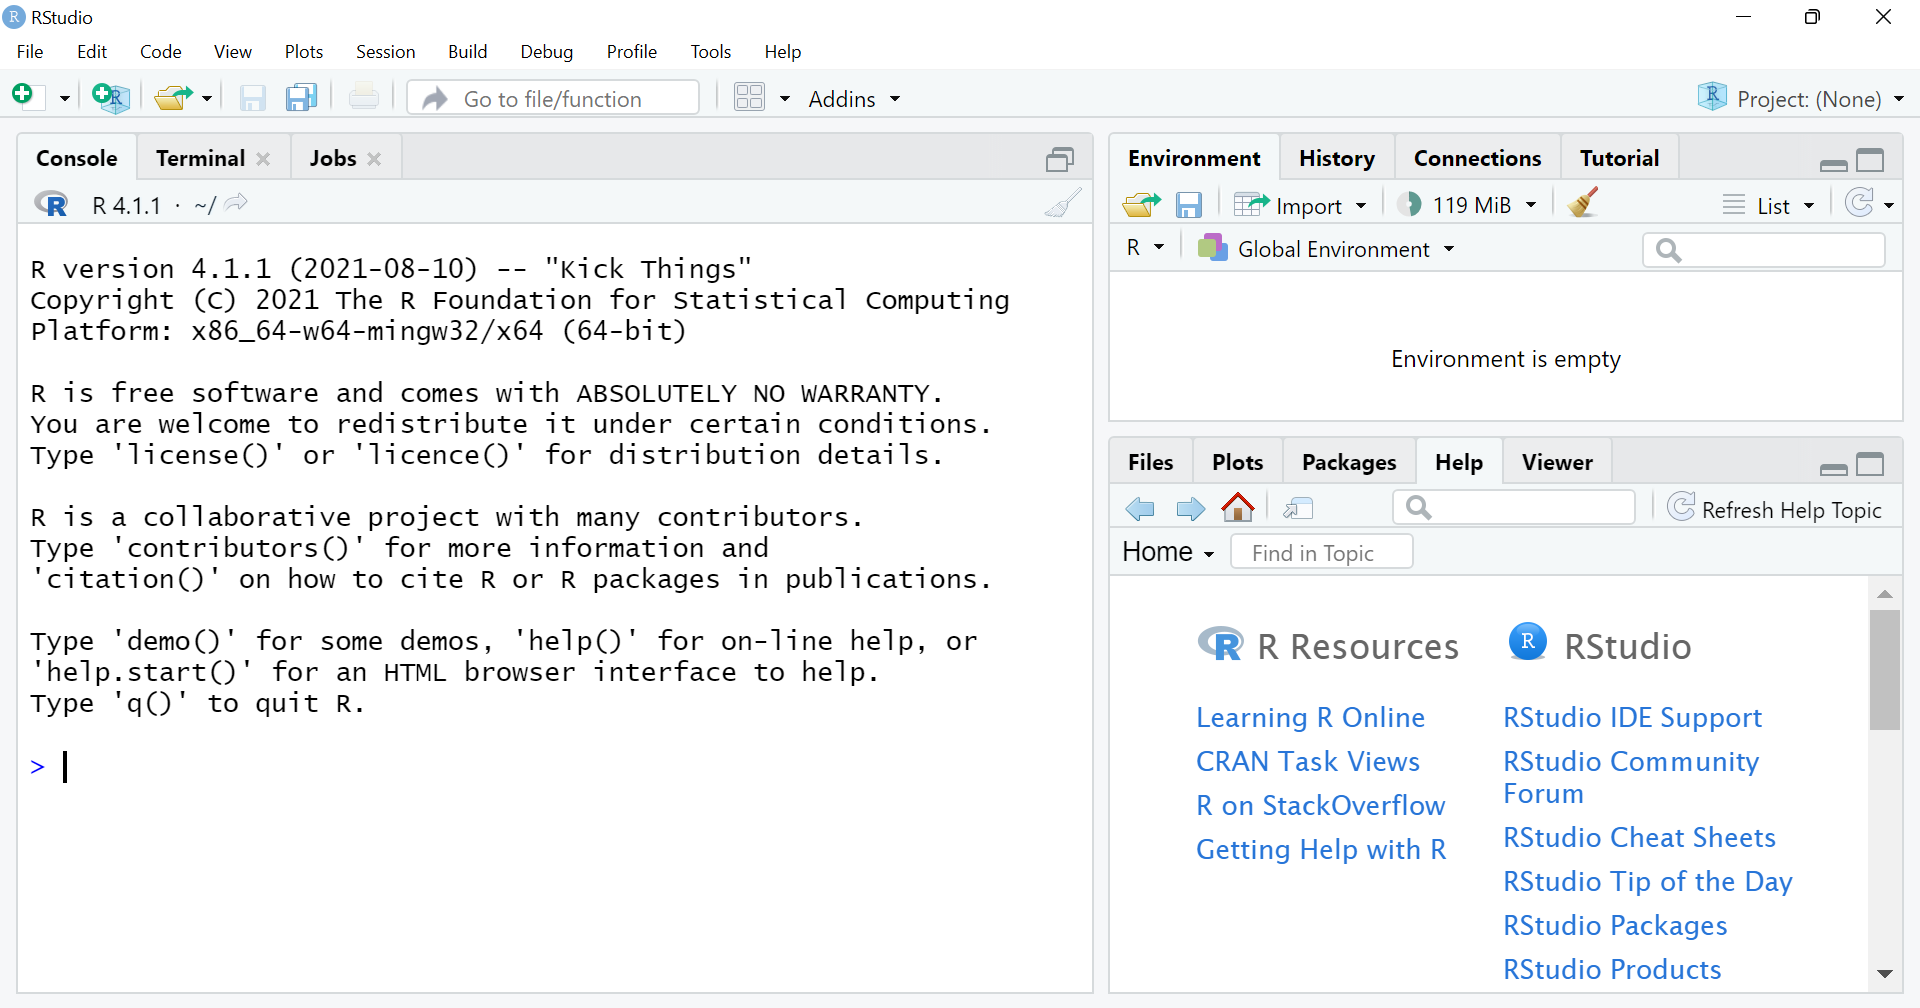
Console
The left side of the window will have one large pane with tabs for Console, Terminal, and Jobs. You will likely only need the Console tab. This is where calculations are actually done. You can start entering code or math calculations at the right arrow >, called the prompt. You can enter one line of code or computations at a time and hit Enter to run the code.
IMPORTANT: If you ever see a new line without a
>prompt, this means the previous line isn’t complete. You might see a+sign, indicating the code is not complete, possibly from a quotation or parenthesis you started but didn’t end (more on this in R Language and Syntax). If you are stuck in this situation, you can hit the Escape button to back out of that code without running it. You may also see no symbol, which means R is still running the previous line of code.
You can try to enter some simple math calculations and hit enter. Notice that R follows the order of operations, so 2 + 3 * 4 is calculated as 2 + 12, resulting in 14. You can use the asterisk for multiplication and the carrot ^ for exponents. For example, 3^2 will compute to 9.
## [1] 14## [1] 9Environment and History
The top right pane will have tabs for Environment, History, and Connections. The Environment tab will list all of the R objects available in your current working session. This will include everything from datasets to saved hypothesis tests and regression models. This will be a useful place to go if you can’t remember the name of something you’ve saved or if you’re having trouble remembering the spelling.
The History tab keeps a record of all of the code you have run in your current session. If you ran some math calculations in the section above, you should be able to go to the History tab and see them recorded there. You will only see the code, not the result.
You likely won’t use Connections much so we won’t hurry about it here.
Files, Plots, Packages, Help
The bottom right pane has additional tabs. The Files tab shows files on your computer. It begins by looking your your working directory (see Computer File Systems and Working Directories for more details), but you can navigate to any folder on your computer.
Plots is where any graphs you make will display and be recorded. When you have multiple plots, you can use the left and right arrows to move through them. The Export button will let you copy or save your plots.
Packages shows all of the R packages currently installed on your computer. Packages with checked boxes are currently loaded into your session. Unchecked boxes mean the package is installed on your computer but not loaded into your session. We will talk more about packages in Packages.
The Help tab is where you can look up information about functions. There is a search option in the tab, or if you know the name of the function you want to read about, you can type and run ?functionname in the Console. For example, running ?mean will bring up the help file for the mean function, which will tell you the possible inputs to the function (Arguments) and what the function is calculating (Value).
We will discuss the Viewer tab in R Markdown.
R Script Files
If you go to File -> New -> R Script, the left side of your R Studio window will separate into two panes, the pane with the Console, Terminal, and Jobs going to the bottom. On the top you will have a pane with a tab that says something like “Untitled1” and a blank white box. This is the area where your R script, or code files, will display. You can type code here and send them to the Console by clicking the Run button or typing Control+Enter.
Scripts are the way to save your code so you can go back, re-run lines, and edit old code. They are analogous to Word files and the way statisticians and data scientists do and save their work. You will want to keep your code saved in script files. As the presence of the tab suggests, you can have multiple R script files open at a time, each with its own tab.
IMPORTANT: Typing code into the script file doesn’t run the code. You have to send the code to the console for the computations to be done. Many students will forget this step and wonder why code they can’t find results in their Environment that they coded into their script. The most likely reason is that the code wasn’t run in the current R session.